#MarketTiming – beware the ides of August…

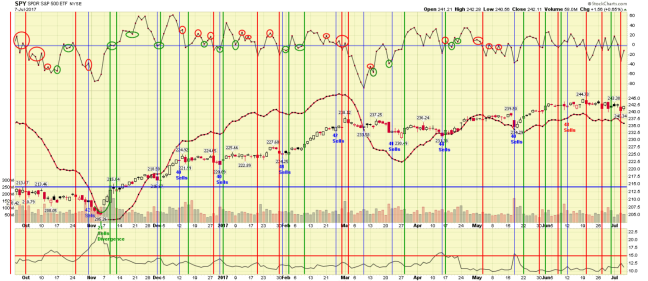
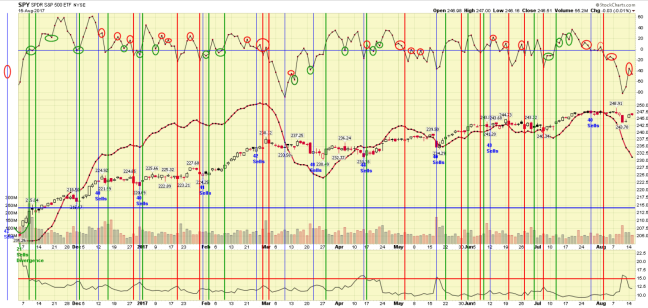
SPY gaped up today, hit yesterday’s suggested 247 resistance on the first five-minute bar, and turned down, down not so much but maybe enough given that that is a lower high since last week’s nuclear Tuesday reversal.

In addition my daily price and breadth indicators also gave sell signals with lower highs. Volatility remains on a buy but it is for the third day in a row which makes any more time tenuous. If it were to turn it would give a higher low in the VIX, a possible hint a change in trend.

Today’s turn down in short-term breadth (see red circle on the chart below) in context with the continued decline in long-term breadth is often a gift the the bears, which is to say the general market should plunge tomorrow.

These are all quiet signals after yesterday blast to the upside which may mean they mean nothing at all and today’s long sideways price action after the open was nothing but a consolidation of yesterday’s gain before proceeding higher.

But these quiet, disquieting, signals could also be like whispers in the night — “beware the ides of August, beware…”

How often has the market topped quietly in August and fallen all the say into October?

SWING TRADING SIGNALS:

PRICE: Sell. Price (Day 1).
SHORT-TERM BREADTH: Sell. (Day 1).
VOLATILITY: Buy, (Day 3).

CONTEXT:

LONG-TERM BREADTH: Sell (Day 10).
CNN MONEY’S FEAR AND GREED INDEX: (36, still at a fear level).
NIFTY-50 STOCK LIST: 42 Buys; 13 Overbought, 2 Oversold, 2 new buys today, 3 new sells.

(click on the chart for a larger view)
SWINGTRADING2017-08-14_1524

#MarketTiming — well…that was a big bounce…

My Nifty-50 stock list went from 39 stocks on sells with 30 oversold at the beginning of the day to 43 on buys and 11 overbought at the close. There were 34 new buy signals on the stocks today.

Thirty-four buys in one day. Can’t remember when last a one-day blast like today happened in the stocks.

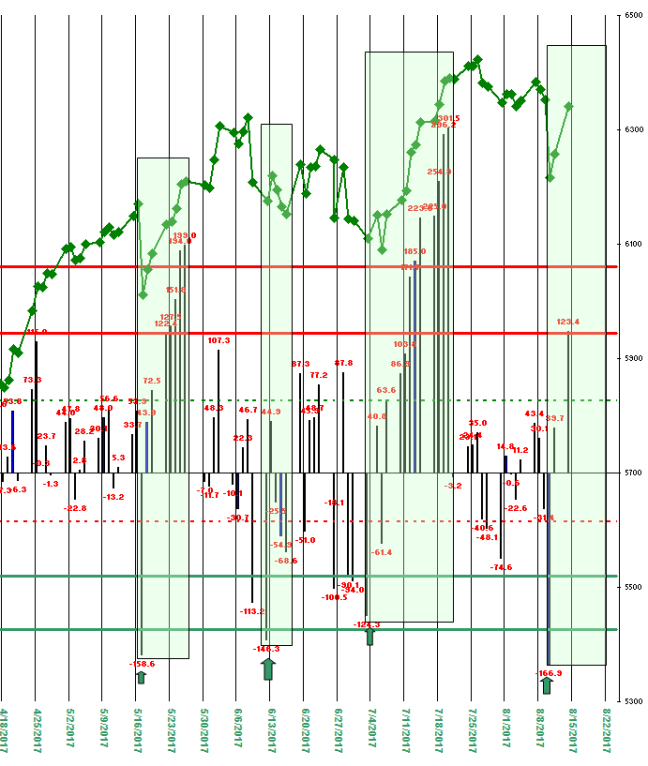
I think the telling number going into today’s trading was that 30 oversold in addition to upthrust from the lower green line and arrow on the chart posted yesterday and updated today (below).

This feels like a buying panic that could I suppose carry to new highs especially on the Nasdaq.

On the S&P it seems more likely it goes up to the levels it was at when it sold off last week and stall (that would be about 247-248 on the SPY, which closed at 246.54 today). If so then we will likely see a retest of last week’s low levels, particularly because long-term breadth is still negative and there is no divergence in the short-term breadth numbers.

But for now this is an obvious bull market that is still going up until one day it is obviously going down.

SWING TRADING SIGNALS:

PRICE: Buy. Price (Day 2).
SHORT-TERM BREADTH: Sell. (Day 2).
VOLATILITY: Buy, (Day 2).

CONTEXT:

LONG-TERM BREADTH: Sell (Day 9).
CNN MONEY’S FEAR AND GREED INDEX: (39, but still at a greed level).
NIFTY-50 STOCK LIST: 43 Buys; 11 Overbought, 1 Oversold, 34 new buys today, 0 new sells.

Stocks in the Nifty-50 list on buy signals: too numerous to list but highlights from on the day include KEM up 7.5%, NVMI up 6.2%, PNK up 6.0% and MOMO up 5.5%.

(click on the chart for a larger view)
Niftyfifty2017-08-13_1806

$KC – a textbook trend change in coffee…

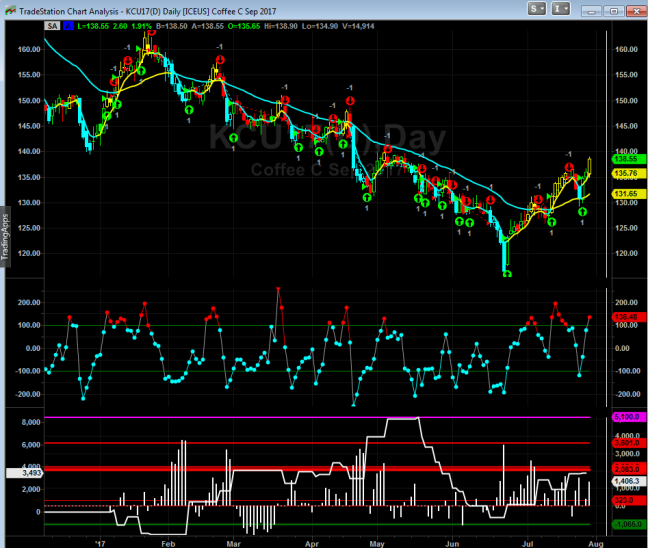
Simply put, after a long choppy but steady down trend, coffee has changed course to an up trend, breaking it’s down sloping moving average, then retesting it perfectly before resuming its new trend to the upside.

Nothing more to say. The chart says it all.

(click on chart for a larger view)

COFFEE2017-07-13_1436

$TQQQ and company – up 9.8%…

Simply, the market will go up until it goes down.

The general market, measured by the Nasdaq, continued up today for the ninth day in a row. And the gains have been rather spectacular – a 9.8 percent gain for a basket of 3x-leveraged ETFs in eight full rally days from the open of 7/10.

This is starting to feel like some kind of blow-off.

Trader Vic Sperandeo, one of the great market wizards, once wrote: “After a long move of intermediate proportions, when you have a 4-day (or longer) sequence in the direction of the trend, the first day down in the opposite direction often signifies the top or the bottom and a change in trend.”

His read may be in play here for the end of this 9-day run in the Nasdaq when it comes. He would suggest an aggressive trading short at the end of the first day down with a stop above the previous high.

Should be noted that today’s action again triggered Breadth and Volatility buy signals to join the price signal still in place on its ninth day. So everything is again a buy, which seems to me kind of scary, but it is what it is.

SWING TRADING SIGNALS:

PRICE: Positive. Long (Day 8).
SHORT-TERM BREADTH: Positive. Long (Day 1).
VOLATILITY: Positive, Long (Day 2).

CONTEXT:

LONG-TERM BREADTH: Positive (Day 6).
FEAR AND GREED INDEX: (74, vaulting higher into the greed level).
NIFTY-50 STOCK LIST: 29 Buys, rising; 20 Overbought,2 Oversold, 20 buys today, 1 new sells.

The rally results so far (eight full days from the open of 7/10):

TQQQ up 13.4 percent.
XIV up 13.8 percent.
UPRO up 5.7 percent.
TNA up 6.3 percent.

The net gain is now 9.8 percent.

$RACE – Ferrari racing up the Darvas stairs…

At the risk of oversimplification, the most effective ways to trade stocks is to keep it simple.

One of the best ever at this was Nicholas Darvas.

His method was to put a simple box around a stock’s price consolidation and buy it as the stock came out of the top of the box and either put a stop loss below his trade price (which would be a tight stop if the stock came back into the box) or below the bottom of the box (depending on anyone’s individual risk parameters).

Darvas said he never shorted a stock dropping below the bottom of a box only because he felt he was not psychologically suited to selling short. Still that would be, especially in a bear market, as simple of buying the top of one of his boxes in a bull market.

Darvas’ book “How I Made $2,000,000 In The Stock Market” (this was the 1950s) describes his “Box System”. It is a classic. And timeless – see the chart of RACE below.

I have said before the easiest way to buy or not buy an IPO is to put a box on the high and low of its first day of trading and buy above the top of the box and short below the box. While an IPO’s first day is itself a Darvas box (blue on the chart below) as one can see here there are others also very worthwhile for the trader as well as a longer-term investor.

(Click on chart for a larger view)

RACE2017-07-18_0928

#SwingTrading – taking profits…

The Nasdaq Composite is up seven days in a row. That is a true testament to the bullishness of this bull market.

My price only trading signal as a result is still positive (will be until it turns down) but seven in a row is rare so a pause in this rally can come any day, any minute. My volatility signal has risen six days in a row before triggering a sell for either today’s close or tomorrow’s open.

With both the short-term breadth and volatility signals on sells now taking some profits would be in order.

Should also be noted that the stock in the nifty-50 list have been rolling over from a high 0f 43 on buy signals four days ago to less than 50 percent on buys today at 21.

However, long-term breadth remains positive so any weakness here is not a short so much as a dip to buy. Often, with a strong 7-day run like this, dips are for only one day before the advance resumes.

SWING TRADING SIGNALS:

PRICE: Positive. Long on last Monday’s open (Day 7).
SHORT-TERM BREADTH: Negative. Flat on today’s close or tomorrow’s open (Day 1).
VOLATILITY: Negative on today’s close (Swing Trade Day 7).

CONTEXT:

LONG-TERM BREADTH: Positive (Day 4).
FEAR AND GREED INDEX: (67, rising into the greed level).
NIFTY-50 STOCK LIST: 21 Buys, falling; 17 Overbought,4 Oversold, 5 buys today, 14 sells.

The rally results so far (seven full days):

TQQQ up 9.3 percent.
XIV up 11.3 percent.
UPRO up 4.0 percent.
TNA up 4.2 percent.

The net gain for a basket of the above leveraged ETFs for the trade is 7.2 percent.

(Disclaimer: This blog entry and all others here are for entertainment purposes only and should not be construed as direct investment advice.)

CNN Money’s Fear and Greed Index:

(click on chart for a larger view)

fear_and_greed2017-07-17_1525

#MarketTiming – 5 consecutive days up…

The market moved higher again today. This is the fifth day up in a row, and the fourth day of the swing trade from Monday’s open.

A splendid week for the bulls.

Of the three main trade signals — Price, Breadth and Volatility — two remain on buys while short-term breadth turned down today. That’s a signal for swing traders to take some profits – a third off, or more. Breadth, especially after a strong run of five days and especially with significant profits on the table, is often (not always) the sign that an advance has lost its momentum.

In addition, my nifty-50 stock list moved from 43 stocks on buys yesterday to 33 on buys today as 11 of the 34 oversold stocks yesterday clicked down to 23 today.

In other words it will be no surprise if the market dips tomorrow.

This is will not be a time, however, to short but instead an opportunity to buy a dip for more to come going forward (until further notice).

TRADING SIGNALS:

PRICE: Positive. Long on Monday open (Trade Day 4).
SHORT-TERM BREADTH: Negative. A sell for Friday’s open (Trade Day 1).
VOLATILITY: Positive. Long on Monday Open (Trade Day 4).

CONTEXT:

LONG-TERM BREADTH: Positive (Day 2).
FEAR AND GREED INDEX: (54, rising in neutral).
NIFTY-50 STOCK LIST: 33 Buys, rising; 23 Overbought, 0 Oversold, no buys today, 11 sells.

The rally results so far (four full days):

TQQQ up 6.7 percent.
XIV up 6.5 percent.
UPRO up 3.0 percent.
TNA up 2.7 percent.

The net gain for a basket of the above leveraged ETFs for the trade is 4.7 percent.

In the midst of a four day trade it is probably worth taking a look at 10 familiar stocks on this swing:

(click on chart for a larger view)

10_stocks_2017-07-13_1418

#MarketTiming – Day 4 0f Upswing

The general market moved up again today. Fourth consecutive day up on the Nasdaq. It is the third day of the trade from Monday’s open. A four or more day move is where the money is made in swing trading, particularly with 3x-leveraged ETFs (see table below), or options, or futures.

At the same time, this market is getting wildly overbought. Forty-three of my Nifty-50 stocks are on buys, with 34 overbought. This is a lot.

The Nasdaq composite is more than two standard deviations of an average advance. That puts it on borrowed time for more upside. Needless to say, it can borrow more time. Markets go up until they go down. Simple as that, and this bull market has had an inclination to put on more gains just when one thinks it should stall.

It is time still to let profits run since all principal buy signals remain positive and long-term breadth just turned positive also, making this a market now to buy the dips, any dips.

TRADING SIGNALS:

PRICE: Positive. Long on Monday open (Trade Day 3).
SHORT-TERM BREADTH: Positive. Long on Monday open (Trade Day 3).
VOLATILITY: Positive. Long on Monday Open (Trade Day 3).

CONTEXT:

LONG-TERM BREADTH: Positive (Day 1).
FEAR AND GREED INDEX: (47, rising back into neutral).
NIFTY-50 STOCK LIST: 43 Buys, rising; 34 Overbought, 0 Oversold.

The rally results so far (three full days):

TQQQ up 6.0 percent.
XIV up 5.4 percent.
UPRO up 2.3 percent.
TNA up 2.8 percent.

The net gain for a basket of the above leverage ETF for the three days in the trade is 4.1 percent.

$BABA from day one…

With BABA at new all time highs, I marked up the chart below mostly for fun, (although over the years it has been useful), and to suggest one could make a living trading just one stock.

(click on chart for a larger view)

BABA_2017-07-12_1124

#MarketTiming – looking for more upside…

After Friday’s upside surge looking for more up to come.

Trouble is all last week every big up move in QQQ was followed day by an equal drop; same for the SPY. It has been an extremely choppy market of late on a daily basis.

But for now, the three main end-of the-day trading triggers — PRICE, BREADTH, VOLATILITY — are all in buy mode so the market timing is a buy until it is not.

TRADING SIGNALS:

PRICE: Positive. Long on Monday open (Day 1).
SHORT-TERM BREADTH: Positive. Long on Monday open (Day 1).
VOLATILITY: Positive. Long on Monday Open (Day 1).

CONTEXT:

LONG-TERM BREADTH: Negative (Day2).
FEAR AND GREED INDEX: Neutral (49, rising).
NIFTY-50 STOCK LIST: 39 Buys, 11 Sells, 10 Overbought, 4 Oversold.

(click on chart for a larger image)
Spy