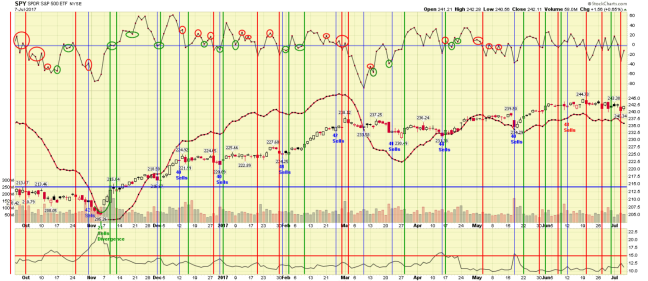
$SPY $QQQ – bouncy bounce time…

Looks like it is time for the bounce from Friday to continue.

All three of my swing-trading signals – Price, Breadth, Volatility – gave buys for Monday’s open after last Thursday’s hard slam to the downside and Friday’s bounce.

Everything is still oversold.

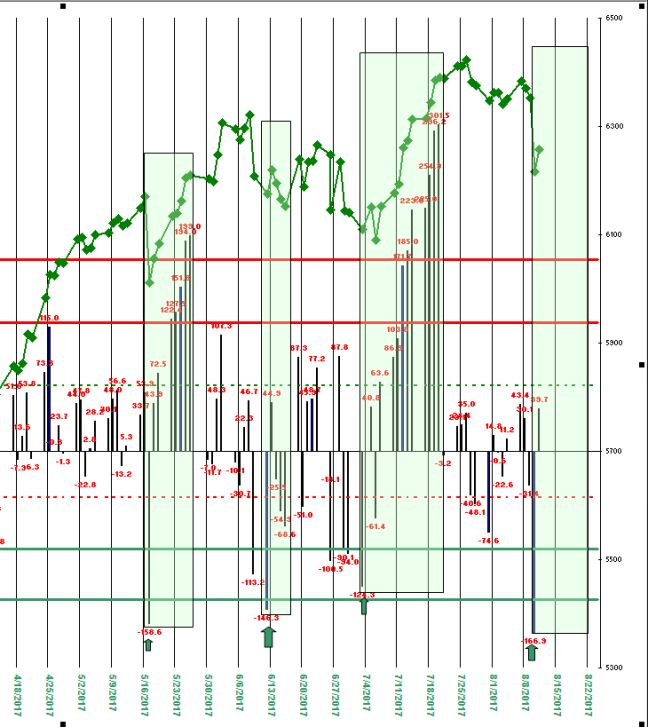
My Nifty-50 stock list had 39 nine stocks on sells Friday for the second day in a row. Forty sells is a marker for a bottom of a swing but sometimes the market just goes to far to fast and doesn’t quite get down that far. Also 30 of those stocks are oversold. Thirty is a lot.

The plunge in price Thursday took the Nasdaq Comp to a level that often marks a bottom, and made Friday’s bounce almost a sure thing (see the chart below of the Nasdaq Comp with the previous signals). Given this bull market it is more likely than not we move up again now.

Caution is needed, however, since long-term breadth remains negative and there is no divergence in short-term breadth so it should be noted that a test or retest of Friday’s lows some time this coming week is also likely.

SWING TRADING SIGNALS:

PRICE: Buy. Price (Day 1).
SHORT-TERM BREADTH: Sell. (Day 1).
VOLATILITY: Buy, (Day 1).

CONTEXT:

LONG-TERM BREADTH: Sell (Day 8).
CNN MONEY’S FEAR AND GREED INDEX: (28, greed level).
NIFTY-50 STOCK LIST: 11 Buys; 1 Overbought, 30 Oversold, 4 new buys today, 4 new sells.

Stocks in the Nifty-50 list on buy signals: EXAS, CC, CZR and MELI.

(click on the chart for a larger view)
Niftyfifty2017-08-13_1806

$QQQ – one-day dip or shot across the bow?

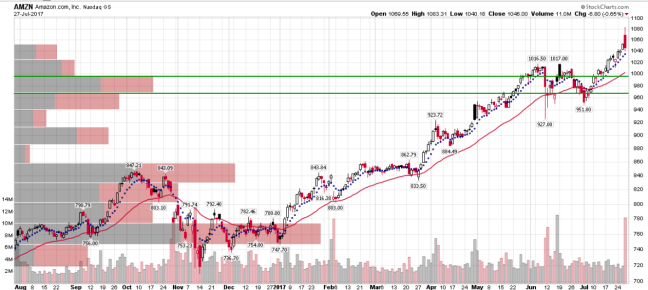
Mid-day today, the Nasdaq sold off – out of the blue and just when everyone was talking about Jeff Bezos of Amazon being the new richest man in the world supplanting Microsoft’s Bill Gates.

Amazon (AMZN) was up 30-some points at the time and finished down for the day, and is now down 55 points for the day in the aftermarket. It’s possible Bezos was the richest man for an hour or so but maybe he still is (someone else, like Forbes, will have to keep track of that).

The reversal ripped through the rest of the Nasdaq 100 (NDX) and the Nasdaq composite. And tore my nifty-50 stock list into 40 stocks on sells. That many sells or more, if not a bottom of a swing, is usually the beginning of a bottom.

In addition, the Dow and the SPX remained up so it is hard to tell the answer to the question in the title above.

Of course, tomorrow will tell.

All three of my end-of-the-day swing trade signals – price, breadth, volatility – are on sells and long-term breadth turned negative but just by a bit.

If the Nasdaq follows through to the downside and takes<the rest of the market with it, the price sell-off threatened over and over again in the internals (breadth and volatility) may finally be at hand.

SWING TRADING SIGNALS:

PRICE: Sell. Price (Day 1).
SHORT-TERM BREADTH: Sell. (Day 2).
VOLATILITY: Sell, (Day 4).

CONTEXT:

LONG-TERM BREADTH: Sell (Day 1).
CNN MONEY’S FEAR AND GREED INDEX: (73, greed level).
NIFTY-50 STOCK LIST: 10 Buys; 8 Overbought, 14 Oversold, 21 new buys today, 4 new sells.

(click on the chart for a larger view)
AMZN2017-07-27_2124

$TQQQ and company – up 9.8%…

Simply, the market will go up until it goes down.

The general market, measured by the Nasdaq, continued up today for the ninth day in a row. And the gains have been rather spectacular – a 9.8 percent gain for a basket of 3x-leveraged ETFs in eight full rally days from the open of 7/10.

This is starting to feel like some kind of blow-off.

Trader Vic Sperandeo, one of the great market wizards, once wrote: “After a long move of intermediate proportions, when you have a 4-day (or longer) sequence in the direction of the trend, the first day down in the opposite direction often signifies the top or the bottom and a change in trend.”

His read may be in play here for the end of this 9-day run in the Nasdaq when it comes. He would suggest an aggressive trading short at the end of the first day down with a stop above the previous high.

Should be noted that today’s action again triggered Breadth and Volatility buy signals to join the price signal still in place on its ninth day. So everything is again a buy, which seems to me kind of scary, but it is what it is.

SWING TRADING SIGNALS:

PRICE: Positive. Long (Day 8).
SHORT-TERM BREADTH: Positive. Long (Day 1).
VOLATILITY: Positive, Long (Day 2).

CONTEXT:

LONG-TERM BREADTH: Positive (Day 6).
FEAR AND GREED INDEX: (74, vaulting higher into the greed level).
NIFTY-50 STOCK LIST: 29 Buys, rising; 20 Overbought,2 Oversold, 20 buys today, 1 new sells.

The rally results so far (eight full days from the open of 7/10):

TQQQ up 13.4 percent.
XIV up 13.8 percent.
UPRO up 5.7 percent.
TNA up 6.3 percent.

The net gain is now 9.8 percent.

#SwingTrading – taking profits…

The Nasdaq Composite is up seven days in a row. That is a true testament to the bullishness of this bull market.

My price only trading signal as a result is still positive (will be until it turns down) but seven in a row is rare so a pause in this rally can come any day, any minute. My volatility signal has risen six days in a row before triggering a sell for either today’s close or tomorrow’s open.

With both the short-term breadth and volatility signals on sells now taking some profits would be in order.

Should also be noted that the stock in the nifty-50 list have been rolling over from a high 0f 43 on buy signals four days ago to less than 50 percent on buys today at 21.

However, long-term breadth remains positive so any weakness here is not a short so much as a dip to buy. Often, with a strong 7-day run like this, dips are for only one day before the advance resumes.

SWING TRADING SIGNALS:

PRICE: Positive. Long on last Monday’s open (Day 7).
SHORT-TERM BREADTH: Negative. Flat on today’s close or tomorrow’s open (Day 1).
VOLATILITY: Negative on today’s close (Swing Trade Day 7).

CONTEXT:

LONG-TERM BREADTH: Positive (Day 4).
FEAR AND GREED INDEX: (67, rising into the greed level).
NIFTY-50 STOCK LIST: 21 Buys, falling; 17 Overbought,4 Oversold, 5 buys today, 14 sells.

The rally results so far (seven full days):

TQQQ up 9.3 percent.
XIV up 11.3 percent.
UPRO up 4.0 percent.
TNA up 4.2 percent.

The net gain for a basket of the above leveraged ETFs for the trade is 7.2 percent.

(Disclaimer: This blog entry and all others here are for entertainment purposes only and should not be construed as direct investment advice.)

CNN Money’s Fear and Greed Index:

(click on chart for a larger view)

fear_and_greed2017-07-17_1525

#MarketTiming – 5 consecutive days up…

The market moved higher again today. This is the fifth day up in a row, and the fourth day of the swing trade from Monday’s open.

A splendid week for the bulls.

Of the three main trade signals — Price, Breadth and Volatility — two remain on buys while short-term breadth turned down today. That’s a signal for swing traders to take some profits – a third off, or more. Breadth, especially after a strong run of five days and especially with significant profits on the table, is often (not always) the sign that an advance has lost its momentum.

In addition, my nifty-50 stock list moved from 43 stocks on buys yesterday to 33 on buys today as 11 of the 34 oversold stocks yesterday clicked down to 23 today.

In other words it will be no surprise if the market dips tomorrow.

This is will not be a time, however, to short but instead an opportunity to buy a dip for more to come going forward (until further notice).

TRADING SIGNALS:

PRICE: Positive. Long on Monday open (Trade Day 4).
SHORT-TERM BREADTH: Negative. A sell for Friday’s open (Trade Day 1).
VOLATILITY: Positive. Long on Monday Open (Trade Day 4).

CONTEXT:

LONG-TERM BREADTH: Positive (Day 2).
FEAR AND GREED INDEX: (54, rising in neutral).
NIFTY-50 STOCK LIST: 33 Buys, rising; 23 Overbought, 0 Oversold, no buys today, 11 sells.

The rally results so far (four full days):

TQQQ up 6.7 percent.
XIV up 6.5 percent.
UPRO up 3.0 percent.
TNA up 2.7 percent.

The net gain for a basket of the above leveraged ETFs for the trade is 4.7 percent.

In the midst of a four day trade it is probably worth taking a look at 10 familiar stocks on this swing:

(click on chart for a larger view)

10_stocks_2017-07-13_1418

#MarketTiming – Day 4 0f Upswing

The general market moved up again today. Fourth consecutive day up on the Nasdaq. It is the third day of the trade from Monday’s open. A four or more day move is where the money is made in swing trading, particularly with 3x-leveraged ETFs (see table below), or options, or futures.

At the same time, this market is getting wildly overbought. Forty-three of my Nifty-50 stocks are on buys, with 34 overbought. This is a lot.

The Nasdaq composite is more than two standard deviations of an average advance. That puts it on borrowed time for more upside. Needless to say, it can borrow more time. Markets go up until they go down. Simple as that, and this bull market has had an inclination to put on more gains just when one thinks it should stall.

It is time still to let profits run since all principal buy signals remain positive and long-term breadth just turned positive also, making this a market now to buy the dips, any dips.

TRADING SIGNALS:

PRICE: Positive. Long on Monday open (Trade Day 3).
SHORT-TERM BREADTH: Positive. Long on Monday open (Trade Day 3).
VOLATILITY: Positive. Long on Monday Open (Trade Day 3).

CONTEXT:

LONG-TERM BREADTH: Positive (Day 1).
FEAR AND GREED INDEX: (47, rising back into neutral).
NIFTY-50 STOCK LIST: 43 Buys, rising; 34 Overbought, 0 Oversold.

The rally results so far (three full days):

TQQQ up 6.0 percent.
XIV up 5.4 percent.
UPRO up 2.3 percent.
TNA up 2.8 percent.

The net gain for a basket of the above leverage ETF for the three days in the trade is 4.1 percent.

#MarketTiming – looking for more upside…

After Friday’s upside surge looking for more up to come.

Trouble is all last week every big up move in QQQ was followed day by an equal drop; same for the SPY. It has been an extremely choppy market of late on a daily basis.

But for now, the three main end-of the-day trading triggers — PRICE, BREADTH, VOLATILITY — are all in buy mode so the market timing is a buy until it is not.

TRADING SIGNALS:

PRICE: Positive. Long on Monday open (Day 1).
SHORT-TERM BREADTH: Positive. Long on Monday open (Day 1).
VOLATILITY: Positive. Long on Monday Open (Day 1).

CONTEXT:

LONG-TERM BREADTH: Negative (Day2).
FEAR AND GREED INDEX: Neutral (49, rising).
NIFTY-50 STOCK LIST: 39 Buys, 11 Sells, 10 Overbought, 4 Oversold.

(click on chart for a larger image)
Spy

$SPY – today the bounce, tomorrow the rally?

Had 44 sells on my nifty-fifty stock list Thursday. Forty plus sells usually marks, if not the bottom of a swing, the beginning of the bottom (see my simple chart below). Now couple that with the NYMO turning the NYSI up again, and the VIX plunging below the magic 15 level (again, after a fifth climactic day up in a row), and the indexes turning up from oversold, and today’s bounce was (short of nuclear war over weekend) almost inevitable.

Now the question is can the bounce continue? Probably, and if the next dip (tomorrow, or whenever) can’t take out what is staring us in the face, I SPY a rally to the top of the SPY range or higher by sell-in-May-and-stay-away time.

And if the next downturn does trip this setup (tomorrow, or whenever), well…that will be rather bearish.

(click on the chart for a larger view)

MASTER2017-04-17_1628

$SNAP #FirstDayBox – Buying an IPO (or not) in one easy lesson…

When a hot IPO is launched, as was the case with Snapchat (SNAP) on March 2, the headlines are usually how much it leaped over it initial offer price.  That is a worthless commentary.  Unless one is on some broker’s favored clientele list, it is impossible to have the stock and to be able to sell it on that leap.

So what to do?

With IPOs this is actually one of the easiest decisions in stock trading.  Simply note the high price and the low price on day one of the IPO.  Those are the lines in the sand (see chart 0f SNAP below).

Buy on a close above the high of the first with a stop loss below the high of the first day. With SNAP that buy would have been at 27.09 on March 3 and it would have been stopped out the next trading at at 26.05, a loss of .3% (that’s the way it goes sometimes).  From there, SNAP declined to an all-time low of 18.90 so that stop loss would have saved a lot of money, to say nothing of the anxiety of being locked into a foolish IPO buy made on whatever day.

It would have been a short sell below 23.50 if the stock could have been borrowed (difficult if not impossible this early in the IPO’s life).  Regardless, today the stock is challenging its “First-Day Box” which would stop out any short sale.

So what to do now?

Basically nothing on the long side.  Until it shows it can trade through its first day, it is not a buy. On the short side (easier to do now) it will be a short on the first down day below the box with the stop loss in the box.

In stock trading there are no easier decision to make than playing off an IPO’s First-day box.

P.S. when a long buy goes well it can become long-term hold as in the case of ACRS, a buy at 12.50 (see the chart below).

(right click on the chart for a better view)

snap2017-03-27_0759

acrs2017-03-27_0830

#FinancialStocks – after running on fumes, finally run out of gas

Since market breadth turned down with conviction on March 3, the banks (like much of the general market) have been defying an impending decline.  But that defiance appears to be over as they have been falling for the past few days, and that fall has accelerated.

GS is now down 6.7%, BAC 8.8% and JPM 4.7%.

GS, a bellwether stock, has how retraced its entire advance since early December. That is  not a good sign for the continuation of this bull market, but will see how that weakness plays out in the fullness of time.

(right click on chart for a larger view)

BANKS2017-03-21_1036