#MarketTiming — well…that was a big bounce…

My Nifty-50 stock list went from 39 stocks on sells with 30 oversold at the beginning of the day to 43 on buys and 11 overbought at the close. There were 34 new buy signals on the stocks today.

Thirty-four buys in one day. Can’t remember when last a one-day blast like today happened in the stocks.

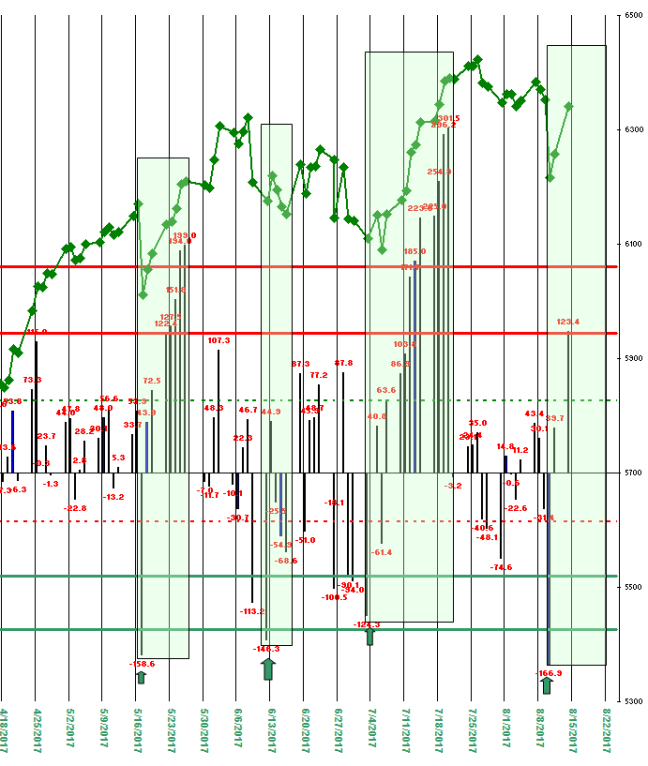
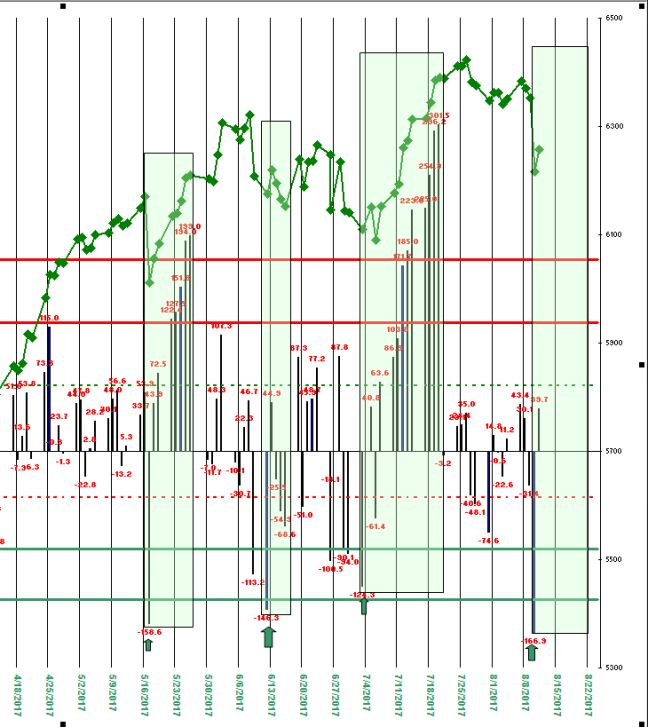
I think the telling number going into today’s trading was that 30 oversold in addition to upthrust from the lower green line and arrow on the chart posted yesterday and updated today (below).

This feels like a buying panic that could I suppose carry to new highs especially on the Nasdaq.

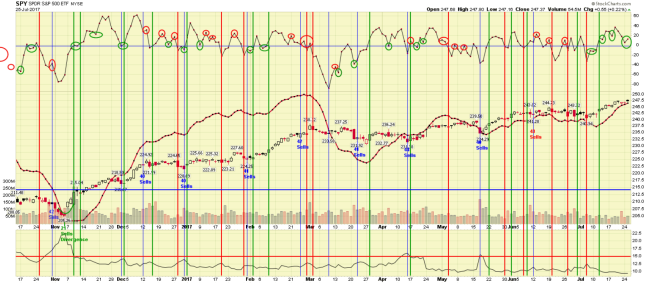
On the S&P it seems more likely it goes up to the levels it was at when it sold off last week and stall (that would be about 247-248 on the SPY, which closed at 246.54 today). If so then we will likely see a retest of last week’s low levels, particularly because long-term breadth is still negative and there is no divergence in the short-term breadth numbers.

But for now this is an obvious bull market that is still going up until one day it is obviously going down.

SWING TRADING SIGNALS:

PRICE: Buy. Price (Day 2).
SHORT-TERM BREADTH: Sell. (Day 2).
VOLATILITY: Buy, (Day 2).

CONTEXT:

LONG-TERM BREADTH: Sell (Day 9).
CNN MONEY’S FEAR AND GREED INDEX: (39, but still at a greed level).
NIFTY-50 STOCK LIST: 43 Buys; 11 Overbought, 1 Oversold, 34 new buys today, 0 new sells.

Stocks in the Nifty-50 list on buy signals: too numerous to list but highlights from on the day include KEM up 7.5%, NVMI up 6.2%, PNK up 6.0% and MOMO up 5.5%.

(click on the chart for a larger view)

Niftyfifty2017-08-13_1806

$SPY $QQQ – bouncy bounce time…

Looks like it is time for the bounce from Friday to continue.

All three of my swing-trading signals – Price, Breadth, Volatility – gave buys for Monday’s open after last Thursday’s hard slam to the downside and Friday’s bounce.

Everything is still oversold.

My Nifty-50 stock list had 39 nine stocks on sells Friday for the second day in a row. Forty sells is a marker for a bottom of a swing but sometimes the market just goes to far to fast and doesn’t quite get down that far. Also 30 of those stocks are oversold. Thirty is a lot.

The plunge in price Thursday took the Nasdaq Comp to a level that often marks a bottom, and made Friday’s bounce almost a sure thing (see the chart below of the Nasdaq Comp with the previous signals). Given this bull market it is more likely than not we move up again now.

Caution is needed, however, since long-term breadth remains negative and there is no divergence in short-term breadth so it should be noted that a test or retest of Friday’s lows some time this coming week is also likely.

SWING TRADING SIGNALS:

PRICE: Buy. Price (Day 1).
SHORT-TERM BREADTH: Sell. (Day 1).
VOLATILITY: Buy, (Day 1).

CONTEXT:

LONG-TERM BREADTH: Sell (Day 8).
CNN MONEY’S FEAR AND GREED INDEX: (28, greed level).
NIFTY-50 STOCK LIST: 11 Buys; 1 Overbought, 30 Oversold, 4 new buys today, 4 new sells.

Stocks in the Nifty-50 list on buy signals: EXAS, CC, CZR and MELI.

(click on the chart for a larger view)

Niftyfifty2017-08-13_1806

$XIV – up 63% on swing trades YTD…

Haven’t posted here for a while. Out of sheer laziness.

In that time, the market gave a buy for today’s open on all three of my swing trading signals – Price, Breadth, Volatility. As a day trade the primary leveraged ETFs I follow were up modestly — TQQQ up 1.28 percent from the open, XIV up .83 percent, UPRO up .34 percent.

Breadth gave a sell for tomorrow’s open so will take some off the table but the other two signals remain in place.

Over at Traders-Talk.com the question was asked today: “Is anyone doing anything novel with the VIX?” I’m not going to tell exactly what is the novel I’m doing except to say I use the VIX to generate the Volatility swing signal, and I suppose this is as good a time as any, to note that XIV, the 3x-leveraged ETF based on the VIX, going long only is up 63 percent on thirty-eight swing signals year to date (with 65% of the trades profitable).

The Volatility signal is posted here everyday (or sometimes, like today, when I get around to it):

SWING TRADING SIGNALS:

PRICE: Buy. Price (Day 2).
SHORT-TERM BREADTH: Sell. (Day 1).
VOLATILITY: Buy, (Day 2).

CONTEXT:

LONG-TERM BREADTH: Sell (Day 4).
CNN MONEY’S FEAR AND GREED INDEX: (63, greed level).
NIFTY-50 STOCK LIST: 33 Buys; 13 Overbought, 6 Oversold, 9 new buys today, 1 new sells.

$QQQ – one-day dip or shot across the bow?

Mid-day today, the Nasdaq sold off – out of the blue and just when everyone was talking about Jeff Bezos of Amazon being the new richest man in the world supplanting Microsoft’s Bill Gates.

Amazon (AMZN) was up 30-some points at the time and finished down for the day, and is now down 55 points for the day in the aftermarket. It’s possible Bezos was the richest man for an hour or so but maybe he still is (someone else, like Forbes, will have to keep track of that).

The reversal ripped through the rest of the Nasdaq 100 (NDX) and the Nasdaq composite. And tore my nifty-50 stock list into 40 stocks on sells. That many sells or more, if not a bottom of a swing, is usually the beginning of a bottom.

In addition, the Dow and the SPX remained up so it is hard to tell the answer to the question in the title above.

Of course, tomorrow will tell.

All three of my end-of-the-day swing trade signals – price, breadth, volatility – are on sells and long-term breadth turned negative but just by a bit.

If the Nasdaq follows through to the downside and takes<the rest of the market with it, the price sell-off threatened over and over again in the internals (breadth and volatility) may finally be at hand.

SWING TRADING SIGNALS:

PRICE: Sell. Price (Day 1).
SHORT-TERM BREADTH: Sell. (Day 2).
VOLATILITY: Sell, (Day 4).

CONTEXT:

LONG-TERM BREADTH: Sell (Day 1).
CNN MONEY’S FEAR AND GREED INDEX: (73, greed level).
NIFTY-50 STOCK LIST: 10 Buys; 8 Overbought, 14 Oversold, 21 new buys today, 4 new sells.

(click on the chart for a larger view)

AMZN2017-07-27_2124

#MarketTiming – chopping at highs…

Kind of a weird choppy day.

Dow up a lot, SPY and Russell touch new highs, Nasdaq not hardly up at all.

And yet two of my three end-of-the-day signals – price and short-term breadth – are on buys signals, the third – volatility – missed registering a buy today by a whisper so I guess we’ll see what tomorrow brings.

Long-term breadth remains positive so there is a good chance the market does move higher tomorrow.

This is a ragged and scary market now which is what bull markets do to traders while investors just blithely hold on until all hell breaks loose (as it always does eventually). The VIX particularly at the moment is making a low not since 2007 just before the last time hell came to visit.

SWING TRADING SIGNALS:

PRICE: Positive. Long (Trade Day 2).
SHORT-TERM BREADTH: Negative. Flat (Day 1).
VOLATILITY: a sell on tomorrow’s open, Flat (Day 2).

CONTEXT:

LONG-TERM BREADTH: Positive (Day 10).
CNN MONEY’S FEAR AND GREED INDEX: (81, rocketed to the extreme greed level).
NIFTY-50 STOCK LIST: 30 Buys, flying; 22 Overbought, 3 Oversold, 8 new buys today, 3 new sells.

(click on chart for a larger view)
MASTER2017-04-17_1628

$UVXY – What a week this could be!

The most compelling thing I can say about the relentless rally going on for the past 11 days is it’s always hard to call a pause, let alone at top, in a bull market.

That said, the sometimes wild and crazy 3x-leveraged VIX ETF, UVXY, has declined 11 days in a row. What dose that matter? Doesn’t UVXY go down all the time? Pretty much, especially for the past five years. But this many days? Well…in the past five years UVXY has gone down 11 consecutive days only once before.

It has not gone down 12.

After 11 days down last time, it bounced 54% in the following 5 days. What a week this could be for the bears!

In the meantime, two of three of my end-of-the-day signals are on sells and flat. The third signal is volatility, still on a buy but after these 11 days stretched so thin it could snap any day, and minute…explosively.


SWING TRADING SIGNALS:

PRICE: Positive. Long (Trade Day 10).
SHORT-TERM BREADTH: Negative. Flat (Day 2).
VOLATILITY: Positive, Long (Day 3).

CONTEXT:

LONG-TERM BREADTH: Positive (Day 8).
CNN MONEY’S FEAR AND GREED INDEX: (73, falling still at greed level).
NIFTY-50 STOCK LIST: 14 Buys, falling; 7 Overbought, 5 Oversold, 0 new buys today, 13 new sells.

The rally results so far (10 full days from the open of 7/10):

TQQQ up 13.7 percent.
XIV up 15.8 percent.
UPRO up 5.6 percent.
TNA up 5.1 percent.

Three of the ETFs backed off a bit Friday, but the advance in XIV managed to move the net gain up from 10.2 percent to 10.4 percent as marked by the Price buy signal on the open of 7/10).

#OptionsTrading – with a dazzling 10 days up in the Nasdaq…

Just a side note on options with the Nasdaq up 10 days in a row (chronicled in the posts below) for the fun of it.

I have three signals that are triggered on the end of a trading day for the next mornings open. They are based on price, breadth and volatility. On July 7th all three registered buys. Since then on a swing trade basis, both breadth and volatility have fluctuated but the price signal has remarkably (and relentlessly) stayed the course for these past nine full days from the open of July 10th.

There are only three things that can happen buying options (in this case, calls) – they go your way, they go down with sideways time decay, or they go against you. Two of the three on the long side will lose money. But when they go your way for a long time, like now, like for 10 days in a row, the results can be dazzling.

All of the call options below were purchasable on the open of July 10th at the prices stated and will expire tomorrow:

TSLA in-the-money (ITM) calls opened at 10.65 and today closed at 19.61.

GOOGL ITM calls opened at 16 and closed today at 51.

AAPL ITM calls opened at 1.41 and closed today at 5.43.

FB ITM calls opened at 3.21 and closed today at 14.52.

AMZN ITM calls opened at 15.10 and closed today at 44.57.

NFLX ITM calls opened at 7.05 and closed today 33.20.

A more spectacular 10-day return one could not ask for – I’ll leave the calculation of each percentage gain to anyone who wants to bother.

(A disclaimer: the information provided here is for educational or entertainment purposes only, mostly my own entertainment, and is not to construed as direct investment or trading advice.)

$SPY and $QQQ – not good behavior…

Both SPY and QQQ gapped up today but both meandered all day pretty much below each’s respective open. That is not good behavior despite the gap gains.

And yet, as I said yesterday, the market will go up until it goes down. So QQQ and its leverage ETF TQQQ again registered another up day, the 10th in a row and SPY is overbought.

Any time now these two major ETFs, representing the NDX and and SPX, are going to have a sell-down (may have to say that again and again until I’m bluer in the face). However, I suspect tomorrow is that day.

There are signs. Less pronounced than before, but again…signs.

Short-term breadth gave a sell signal on the close. The buy signals on the individual stocks in my nifty-50 stock list rolled down from 29 to 26 on buys. The Fear and Greed Index is now in “extreme greed”, a contrarian indicator (although it sill has to turn down to give a sell). As I said, less pronounced.

Again, I need to state since long-term breadth is positive, there are no shorts here, just the possibility of a dip to take some profits, and then to look to buy back in hopefully at some lower level.

SWING TRADING SIGNALS:

PRICE: Positive. Long (Trade Day 9).
SHORT-TERM BREADTH: Negative. Flat (Day 2).
VOLATILITY: Positive, Long (Day 2).

CONTEXT:

LONG-TERM BREADTH: Positive (Day 7).
CNN MONEY’S FEAR AND GREED INDEX: (76, reaching extreme greed level).
NIFTY-50 STOCK LIST: 26 Buys, falling; 19 Overbought, 2 Oversold, 4 new buys today, 7 new sells.

The rally results so far (nine full days from the open of 7/10):

TQQQ up 13.8 percent.
XIV up 14.8 percent.
UPRO up 5.8 percent.
TNA up 6.5 percent.

The net gain is now 10.2 percent as marked by the Price buy signal on the open of 7/10).

(click on the chart for a larger view)

fear_and_greed2017-07-17_1525

$TQQQ and company – up 9.8%…

Simply, the market will go up until it goes down.

The general market, measured by the Nasdaq, continued up today for the ninth day in a row. And the gains have been rather spectacular – a 9.8 percent gain for a basket of 3x-leveraged ETFs in eight full rally days from the open of 7/10.

This is starting to feel like some kind of blow-off.

Trader Vic Sperandeo, one of the great market wizards, once wrote: “After a long move of intermediate proportions, when you have a 4-day (or longer) sequence in the direction of the trend, the first day down in the opposite direction often signifies the top or the bottom and a change in trend.”

His read may be in play here for the end of this 9-day run in the Nasdaq when it comes. He would suggest an aggressive trading short at the end of the first day down with a stop above the previous high.

Should be noted that today’s action again triggered Breadth and Volatility buy signals to join the price signal still in place on its ninth day. So everything is again a buy, which seems to me kind of scary, but it is what it is.

SWING TRADING SIGNALS:

PRICE: Positive. Long (Day 8).
SHORT-TERM BREADTH: Positive. Long (Day 1).
VOLATILITY: Positive, Long (Day 2).

CONTEXT:

LONG-TERM BREADTH: Positive (Day 6).
FEAR AND GREED INDEX: (74, vaulting higher into the greed level).
NIFTY-50 STOCK LIST: 29 Buys, rising; 20 Overbought,2 Oversold, 20 buys today, 1 new sells.

The rally results so far (eight full days from the open of 7/10):

TQQQ up 13.4 percent.
XIV up 13.8 percent.
UPRO up 5.7 percent.
TNA up 6.3 percent.

The net gain is now 9.8 percent.

$QQQ – Ain’t got nothing but love, babe, eight days a week…

The Nasdaq Composite and its relevant ETFs – QQQ and the 3x-leveraged TQQQ – are now up eight days in a row.

Said in yesterday’s entry here that the momentum in an index that can rise seven consecutive days often only allows a one-day dip before resuming its rally. This time is appears the gap down on the open today, as small as it was, may have been all the dip allowed in this advance.

With long-term breadth positive, my guess is the market goes up another couple of days, and any dip, whenever, remains a dip to buy.

At the same time there are more and more signs that it is running on fumes.

This advance on TQQQ is up three standard deviations of an average advance. That is rare and not sustainable for long. The stocks in my nifty-fifty list continue to roll over. While the price buy signal remains in place, today’s up move could turn neither short-term breadth nor volatility back to buys.

Also, with long-term breadth positive there is no reason to short anything.

SWING TRADING SIGNALS:

PRICE: Positive. Long (Day 8).
SHORT-TERM BREADTH: Negative. Flat (Day 2).
VOLATILITY: Negative, Flat (Day 2).

CONTEXT:

LONG-TERM BREADTH: Positive (Day 5).
FEAR AND GREED INDEX: (62, pulling back but still at the greed level).
NIFTY-50 STOCK LIST: 16 Buys, falling; 10 Overbought,5 Oversold, 2 buys today, 8 new sells.

The rally results so far (seven full days):

TQQQ up 11.4 percent.
XIV up 12.5 percent.
UPRO up 4.2 percent.
TNA up 3.4 percent.

The net gain for a basket of the above leveraged ETFs for the trade is 7.8 percent.

Some notable stocks from my lists for the past week:

Notable_stocks2017-07-18_2327