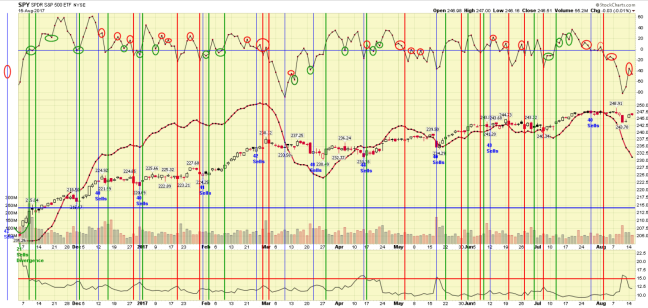
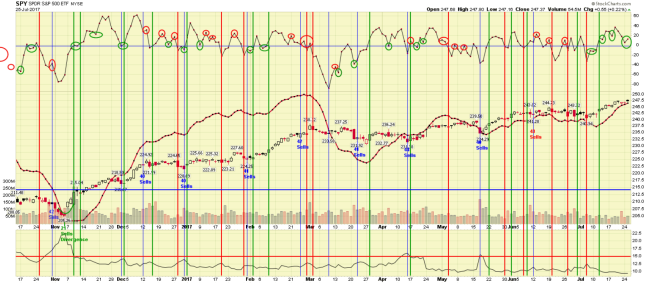
SPY gaped up today, hit yesterday’s suggested 247 resistance on the first five-minute bar, and turned down, down not so much but maybe enough given that that is a lower high since last week’s nuclear Tuesday reversal.
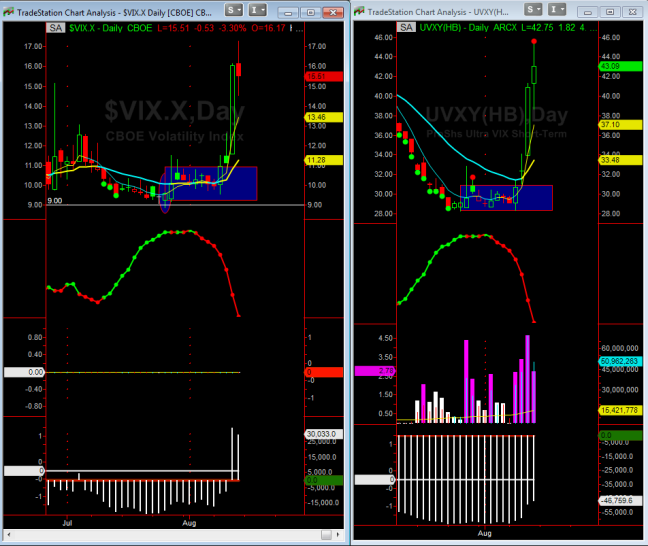
In addition my daily price and breadth indicators also gave sell signals with lower highs. Volatility remains on a buy but it is for the third day in a row which makes any more time tenuous. If it were to turn it would give a higher low in the VIX, a possible hint a change in trend.
Today’s turn down in short-term breadth (see red circle on the chart below) in context with the continued decline in long-term breadth is often a gift the the bears, which is to say the general market should plunge tomorrow.
These are all quiet signals after yesterday blast to the upside which may mean they mean nothing at all and today’s long sideways price action after the open was nothing but a consolidation of yesterday’s gain before proceeding higher.
But these quiet, disquieting, signals could also be like whispers in the night — “beware the ides of August, beware…”
How often has the market topped quietly in August and fallen all the say into October?
SWING TRADING SIGNALS:
PRICE: Sell. Price (Day 1).
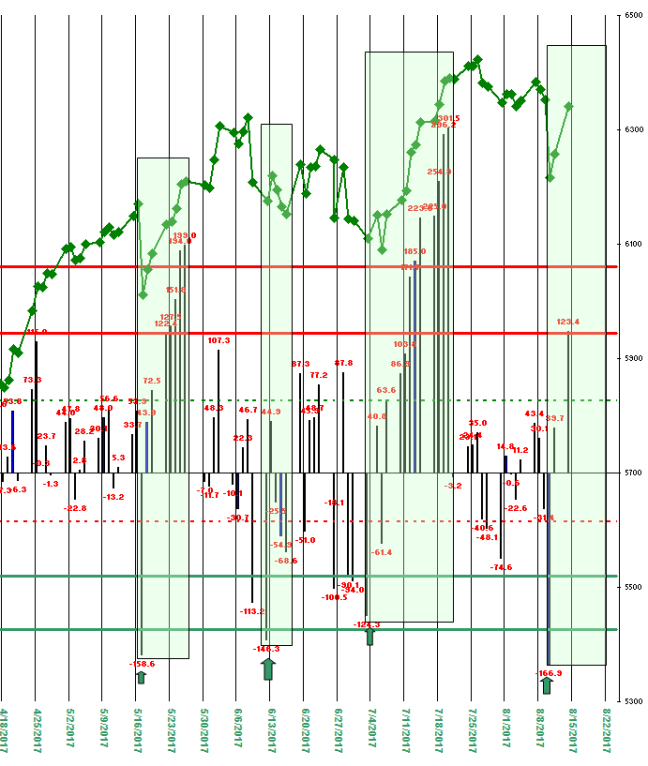
SHORT-TERM BREADTH: Sell. (Day 1).
VOLATILITY: Buy, (Day 3).
CONTEXT:
LONG-TERM BREADTH: Sell (Day 10).
CNN MONEY’S FEAR AND GREED INDEX: (36, still at a fear level).
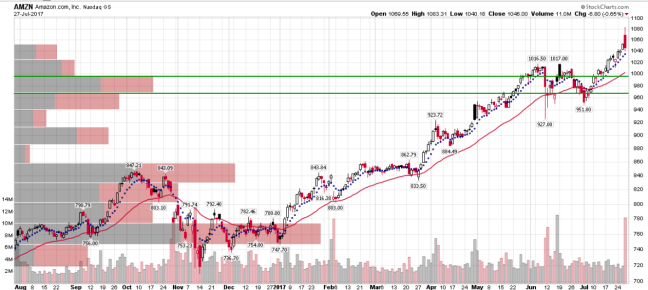
NIFTY-50 STOCK LIST: 42 Buys; 13 Overbought, 2 Oversold, 2 new buys today, 3 new sells.
(click on the chart for a larger view)